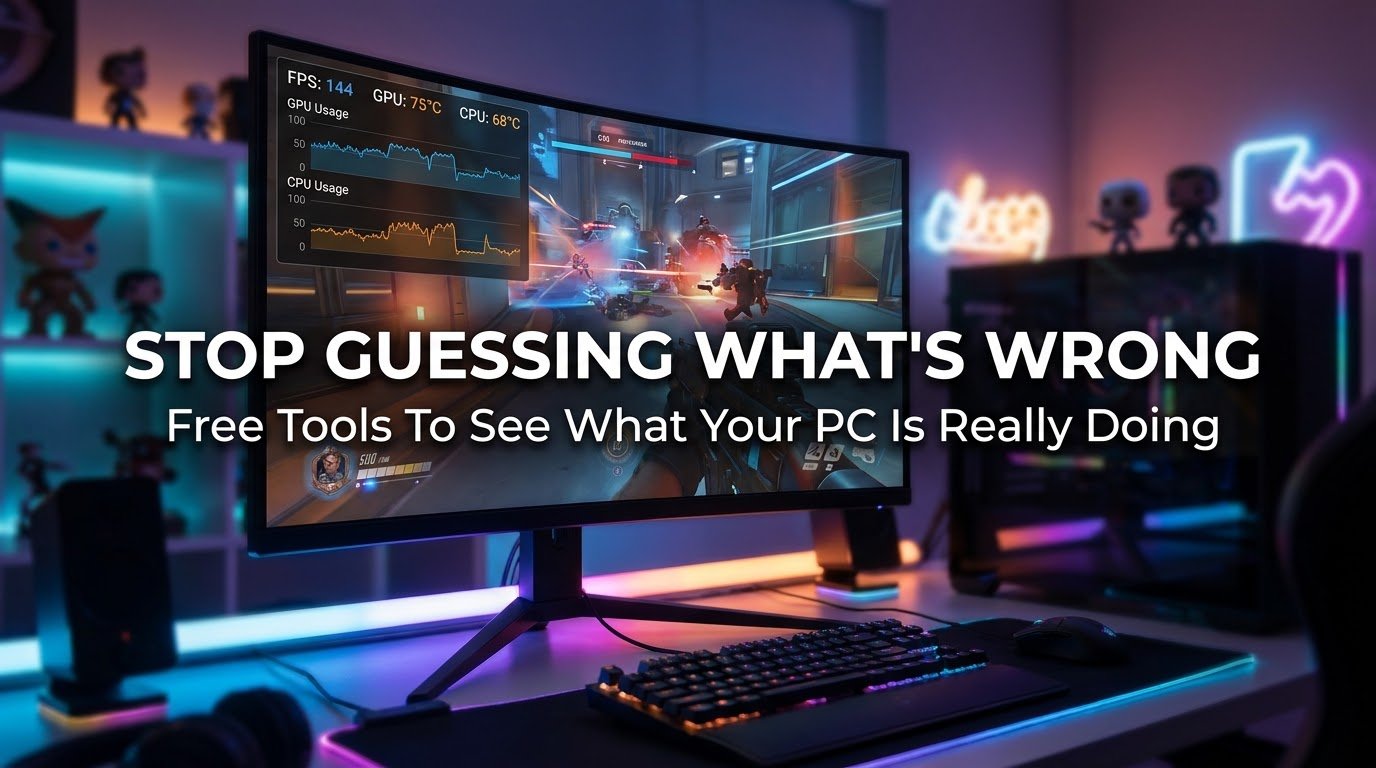
“It just feels laggy” was my entire diagnosis process for way too long. No numbers, no actual data, just a vague feeling that something wasn’t right while gaming, followed by me randomly changing settings and hoping something worked.
That approach wasted so much of my time. I’d lower graphics settings that didn’t need lowering, update drivers that weren’t the problem, and completely miss actual issues because I genuinely had no idea what was happening inside my PC while I was gaming.
Once I started actually monitoring my temps, FPS, and resource usage properly, troubleshooting stopped being a guessing game. I want to walk through the exact free tools I use now, because they’ve saved me hours of pointless trial and error since.
Why Monitoring Actually Matters (Beyond Just Looking Cool On Stream)
A lot of people think monitoring tools are just for content creators showing off overlays. That’s not really the point though, at least not for me.
Monitoring tools tell you exactly what’s happening in real time. Is your CPU maxed out while your GPU sits idle? That’s a bottleneck. Is your temperature spiking right before a stutter? That’s thermal throttling. Is your FPS tanking during specific moments in a game? Now you know exactly when and why, instead of just feeling like “something’s off.”
Without this data, you’re troubleshooting blind. With it, you’re actually solving problems instead of guessing at them.
The Tools I Actually Use (And Trust)
MSI Afterburner + RivaTuner Statistics Server
This combo is basically the industry standard, and for good reason. MSI Afterburner handles GPU monitoring and control, while RivaTuner Statistics Server (which installs alongside it automatically) gives you the customizable on-screen overlay showing FPS, temps, and usage while you’re actually gaming.
I use this as my main overlay, positioned in the top corner of my screen, showing GPU temp, GPU usage, CPU usage, and current FPS at all times. It took some digging through the settings menu to figure out how to customize what shows up, but once set up, it just runs quietly in the background every time I boot my PC.
Step-by-step setup:
- Download MSI Afterburner from the official MSI website, RivaTuner installs automatically alongside it
- Open Afterburner, click the Settings gear icon
- Go to the “Monitoring” tab
- Check the boxes next to the stats you want visible (GPU temp, GPU usage, CPU usage, FPS, RAM usage)
- For each stat you check, make sure “Show in On-Screen Display” is also selected
- Launch a game, and your overlay should appear automatically in the corner you configured

HWMonitor
While Afterburner is great for in-game overlays, HWMonitor is what I use specifically for deeper temperature and voltage readings across every component, not just my GPU.
I mainly use this one before and after making hardware changes, like after cleaning dust out of my laptop or reapplying thermal paste, to get a clear before-and-after comparison. It shows minimum, maximum, and current readings for temperatures, fan speeds, and voltages across your CPU, GPU, and motherboard.
I actually relied on this heavily while diagnosing high CPU usage issues on my own system a while back, which I detailed in How to Fix High CPU Usage While Gaming, if you want to see exactly how I used this data to track down the actual cause instead of just guessing.
Task Manager (Yes, The Built-In One)
I ignored this for way too long because it felt too basic to actually matter. That was a mistake. Task Manager’s Performance tab gives you a genuinely useful real-time breakdown of CPU, memory, disk, and GPU usage without installing anything extra.
I press Ctrl+Shift+Esc before launching demanding games now, just to get a quick baseline check of what’s already running and how much of my resources are free before I even start playing.
CapFrameX
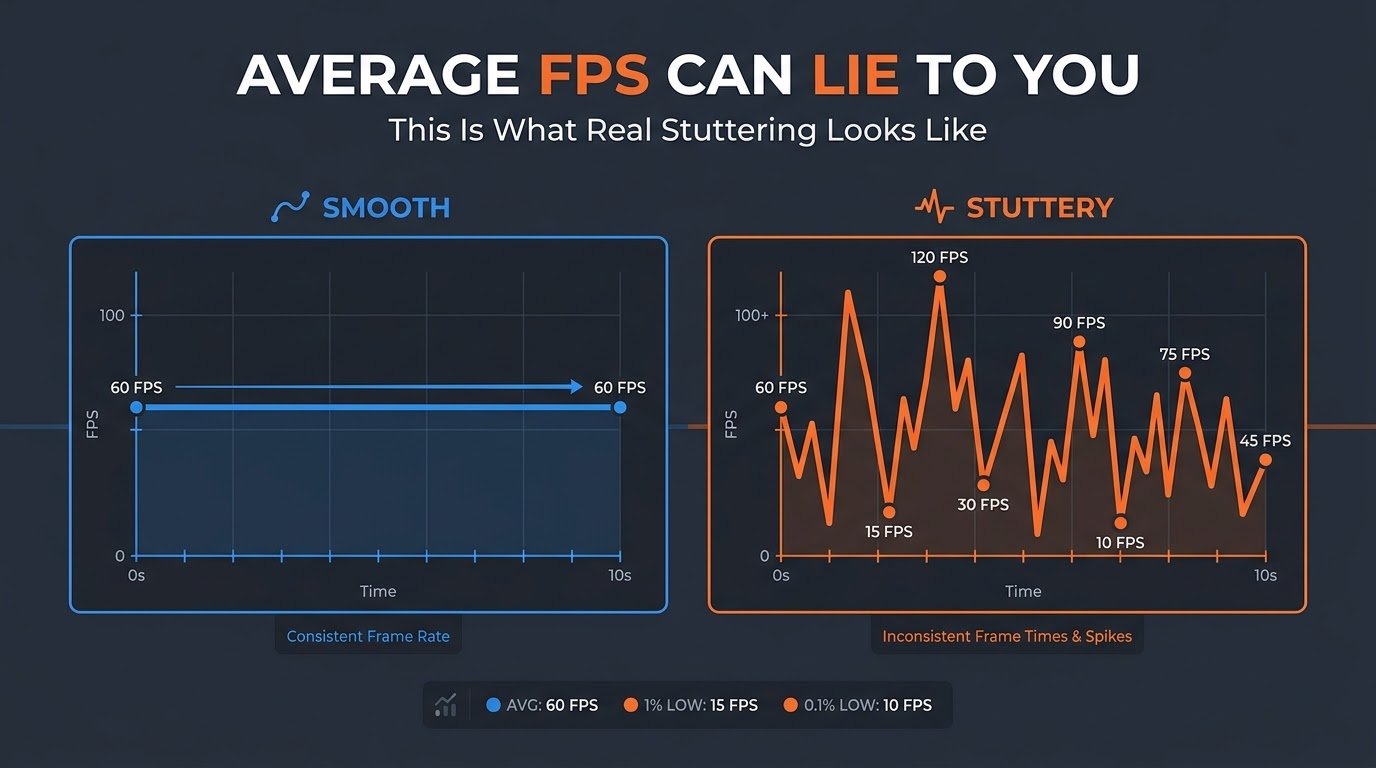
This one’s a bit more advanced, but incredibly useful once you understand it. CapFrameX doesn’t just show your average FPS, it captures detailed frame time data, which reveals stuttering that a simple FPS counter might completely miss.
I discovered this after noticing my average FPS looked totally fine on paper, around 90fps, but the game still felt stuttery during gameplay. CapFrameX revealed inconsistent frame times were the actual culprit, something a basic FPS counter never would have shown me.
How I use it:
- Download CapFrameX from their official GitHub page
- Launch it alongside your game
- Use the hotkey (default F11) to start and stop a capture session during gameplay
- Review the frame time graph afterward to spot inconsistent spikes, not just your average FPS number
HWiNFO
For anyone who wants genuinely comprehensive system data, HWiNFO is about as detailed as free tools get. It’s a bit overwhelming at first with how much information it throws at you, but it’s incredibly thorough.
I mainly use this one when I’m trying to diagnose something specific and unusual, like unexplained voltage fluctuations or checking exact sensor readings that other tools don’t display as clearly.
GPU-Z
This is a simpler, more focused tool specifically for GPU information. I use it mainly to double-check my GPU’s clock speeds, memory usage, and power draw when I want a quick, no-frills snapshot without opening a full monitoring suite.
It’s also genuinely useful for verifying your GPU is actually running at the specs it’s supposed to, which came in handy once when I suspected (correctly, as it turned out) that my laptop’s GPU was running below its rated clock speed due to poor cooling.
A Mistake I Made Early On With Monitoring Tools
I used to run way too many monitoring tools simultaneously, thinking more data meant better troubleshooting. Afterburner, HWiNFO, and Task Manager all open at once, all displaying overlapping information.
This actually made things worse, not better. The overlays cluttered my screen, and some tools competing for the same sensor data occasionally caused minor performance hits themselves, which is a little ironic considering the whole point was improving performance.
Now I keep it simple. Afterburner’s overlay runs constantly for quick reference, and I only open something like HWiNFO or CapFrameX when I’m actively diagnosing a specific issue.
Real Example: How I Used These Tools Together
During a recent stuttering issue in a newer game, I first checked my Afterburner overlay and noticed my GPU usage was sitting oddly low, around 60%, while my CPU usage was maxed out at 100%. That immediately told me I had a CPU bottleneck, not a GPU problem, which completely changed my troubleshooting direction.
I then used CapFrameX to confirm inconsistent frame times were happening specifically during those CPU-heavy moments, and HWMonitor to check if overheating was contributing to the issue. Turned out it wasn’t a heat problem at all, just genuinely maxed-out CPU usage from background processes I hadn’t closed properly.
Without these tools, I probably would have spent hours adjusting GPU settings that had nothing to do with the actual problem.
Common Mistakes People Make With Monitoring Tools
Running too many overlays at once. I learned this one the hard way. Pick one primary overlay for everyday use and only bring in additional tools when actively troubleshooting something specific.
Only checking average FPS and ignoring frame time consistency. A game can have a great average FPS and still feel stuttery. Tools like CapFrameX catch what basic FPS counters miss entirely.
Never establishing a baseline before making changes. Without knowing your “before” numbers, you genuinely can’t tell if a fix actually worked or if it’s just placebo.
Downloading monitoring tools from random third-party sites. Always grab these directly from official sources (MSI’s website, GitHub pages, or the developer’s own site) to avoid bundled junk software or worse.
Ignoring the data once you have it. I’ve caught myself staring at high CPU usage numbers without actually acting on what they were telling me. The data only helps if you actually use it to make changes.
Final Thoughts
Guessing what’s wrong with your PC while gaming is genuinely a waste of time compared to just looking at the actual numbers. Once I started properly monitoring temps, FPS, and usage, my troubleshooting got faster and a lot more accurate.
You don’t need every tool I mentioned here running at once. Start with MSI Afterburner for a simple overlay, and bring in something like HWMonitor or CapFrameX when you’re dealing with a specific issue that needs deeper investigation.
Give it a try during your next gaming session. You might be surprised at what your PC’s actually doing behind the scenes, and how much easier troubleshooting becomes once you’re working with real data instead of just a vague feeling that something’s off.
For a broader technical breakdown of what different sensor readings actually mean, Tom’s Hardware’s guide on PC monitoring basics is a solid resource if you want to understand the numbers these tools are showing you at a deeper level.